
For most trading and manufacturing companies, min-max appears to be the best approach: set minimums, set maximums, and use either the system or spreadsheets to determine when to place an order. At first glance, everything seems straightforward. In practice, though, there is a common outcome – too much inventory as a whole, and frequent stock-outs for the products that really matter.
It is not only the problem of static min-max parameters or infrequent updates. With modern AI tools, we can calculate min-max every single day. The real challenges lie beyond those.
Static logic in a non-static world
The traditional min-max approach implies that just a few figures are needed to describe the true picture of an item for an extended period of time: average demand, variability, lead time, and service level target. Whether these figures are determined annually or daily by some artificial intelligence, the logic is the same:
- Forecast a “reasonable” range of future inventory based on past experience.
- Consider this range as the primary point of reference for decision-making.
This approach only makes sense when the environment will behave more or less as it behaved before, but in practice:
- New customers and loss of customers impact the demand.
- Lead times change due to increased or decreased capacity of suppliers, new locations of their production facilities, or various disruptions.
- Items change their functions: C-category items of last year can be the core components of a new product or a new channel this year.
In any case, the min-max approach, even when frequently updated, still operates under the assumption of continuity and is always addressing the following question: “What if tomorrow will resemble yesterday?” In the volatile business environment, this very “what if” is the key question to address.
Previous sales are not the current demand
Almost all min-max algorithms and any AI that calibrates min-max optimization are based heavily on previous sales. This leads to one serious flaw:
- Sales tell us how many units we have managed to sell.
- But they don’t tell us how many units potential customers would like to buy, yet can’t because the product is sold out.
- Each out-of-stock day gets registered as zero sales, not lost demand.
If an item had high demand, but was regularly sold out last year, the historical information could show very low volume. Then, a min-max model optimized based on such historical sales information could easily conclude that the demand is poor and lower safety stock levels.
In other words:
- The information is not objective; it already reflects the results of previous inventory management mistakes.
- You will just optimize the mistakes made in the past.
AI will make it work better mathematically, but it won’t change the reality.
Averages and snapshots cover up the real picture
Min-max systems and spreadsheets usually depend on averages and current data:
- Average monthly demand, average lead time, average variance.
- Current stock vs. minimum and maximum, plus a suggested order.
The thing that they usually fail to capture is the nature of the product:
- Does it oscillate wildly between overstocks and stockouts?
- Did it suddenly increase or decrease demand significantly?
- Is this product spending most of its life in a “too comfortable” position?
Averages make the oscillations even out, and snapshots mask the pattern. It’s possible to look at an item that is “within band” right now and think that everything is okay, whereas it has been oscillating between extremes for the last six months.
Without a time-based perspective, it’s difficult to tell:
- Which min-max configurations are truly safeguarding the flow.
- Which ones are merely tying capital in unturned stock.
- When the logic itself needs changing, not just the current order.
Everything is treated equally in the table
In a traditional min-max spreadsheet, everything is merely a row:
- Item number, description, min, max, stock, recommended order.
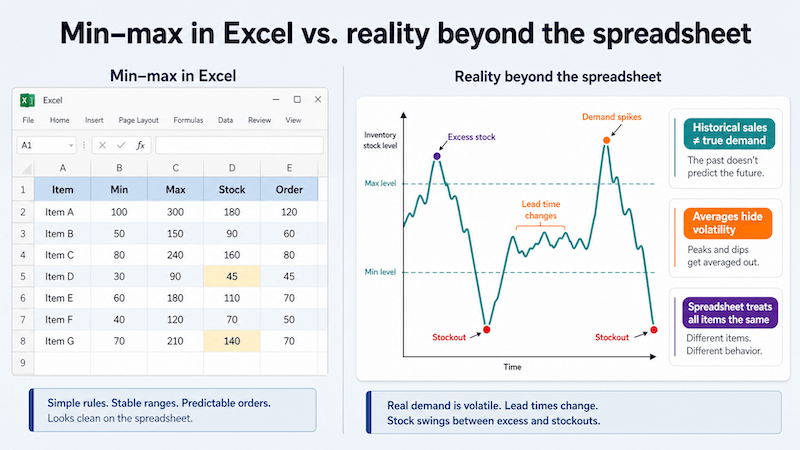
Grid doesn’t give any information about:
- Items which generate a major part of revenue or throughput.
- Items without which production will stop working.
- Items which have narrow use and can be safely excluded from the strategy.
Without additional flags and maintenance, min-max logic will treat all the items equally and as a result:
- Low criticality items will have excess stock “because we don’t want any problems with them”.
- High criticality items will have insufficient min-max values, which were set too cautiously or haven’t been updated.
- Planners spend time chasing parameters on many items while they should concentrate only on those which really protect flow.
The spreadsheet is very good at showing levels; it is very weak at encoding item criticality in a way that drives daily decisions.
Why min-max tends to keep inventory higher than TOC dynamic buffers?
There is another important weakness of the min-max method: by design, it tends to hold more inventory than a TOC dynamic buffer based approach.
In a classic min-max setup:
- An item is ordered when stock hits the minimum, not on a fixed, regular supply schedule.
- Every time it is ordered, it is typically replenished all the way up to the maximum.
In practice, that means:
- You are not ordering “what is needed to safely cover the supply cycle” (order frequency plus lead time).
- You are ordering “up to max,” which often overshoots what the cycle actually requires.
- Orders therefore tend to be less frequent but larger.
The consequences are:
- More space is occupied in the warehouse, because bigger lots sit on the shelf for longer.
- More working capital is frozen at each replenishment moment, because cash is tied up in big batches instead of smaller, right‑sized orders.
AI can help recompute min-max, but it doesn’t solve these structural challenges
It looks like a tempting idea to integrate AI into min-max: the algorithm is able to go through historical data, account for seasonality, handle volatility, and compute min-max regularly. It really solves some problems:
- Parameters are not locked in for a year.
- Recent trends are accounted for faster.
- There’s less need to “tweak the numbers” in Excel.
Nevertheless, there are a few more challenges:
- AI works on the basis of historical data. It can forecast, but cannot ensure that tomorrow is going to be like yesterday.
- If the data used has been distorted due to stockouts, promotional activities, or something else, then AI can produce very accurate calculations based on very distorted data.
- Output is still minimums and maximums of each SKU. If the user interface doesn’t change, the planner still has to deal with the tables of numbers, rather than risk assessment and priorities.
Thus, the challenge becomes not “min-max is static”; but rather “min-max is backward-looking and parameter-centric”.
Some real-life problems that min-max and spreadsheets cannot reveal
From an external perspective, a min-max system backed by spreadsheets or AI appears very advanced. However, some persistent problems cannot be seen in such a system:
- Out of stock of important SKUs and high levels of total inventory at the same time
- Despite the fact that some SKUs are constantly out of stock, the financial statements reflect high amounts of capital invested in the inventory. Many items are within limits in the spreadsheet, and one does not see how wrong the approach is.
- Silent overstock of slow-moving items
- Slow-moving items never become under the minimum level, so there is no need for alarming. Slowly, they accumulate excessive stock until someone sees the items becoming expired, obsolete, or just unnecessary.
- Gradual lead‑time drift
- Suppliers increase lead times, and the process is not reflected somewhere in the parameters. Safety levels are calculated according to outdated information. Everything seems to be OK in the min-max report until the big stockout happens.
- Modification of parameters without any underlying logic
- The numbers are modified based on reactive behavior: “increase the minimum as there was an issue last month” or “decrease the maximum as Finance has requested less stock.” With time, the numbers are modified, but there is no underlying logic to support them across the whole business. The numbers are shown in the spreadsheet, but not the logic behind them.
None of these issues fit the neat categories like “min below threshold” or “max above threshold.” They are behavioral issues.
Risk in essence: depending solely on historical data for flow control in the future
Your question “what about that past sales and information can not match with future?” gets to the very core. No matter which logic you apply in inventory management based on historical data – from basic spreadsheet to sophisticated AI:
- Tomorrow is predicted to be like today.
- The risk will always lie in “what if?”: what if the demand changes, what if a new customer enters, what if the supplier falls apart, what if the product gains/loses its importance significantly?
Historical data is needed; however, it is far from enough. It shows what happened in the system as a result of previous decisions and conditions. It does not tell on its own in which places you would like to keep your security and risks.
That is the gap that min-max cannot fill on its own, even if it is recalculated every single day. It will perfect the math, but it cannot substitute for the necessity of a clear, forward-looking logic with regard to:
- Which elements require more protection.
- The amount of risk one is ready to take and where.
- Prioritization in action every day.
For most trading and manufacturing companies, min-max appears to be the best approach: set minimums, set maximums, and use either the system or spreadsheets to determine when to place an order. At first glance, everything seems straightforward. In practice, though, there is a common outcome – too much inventory as a whole, and frequent stock-outs for the products that really matter.
It is not only the problem of static min-max parameters or infrequent updates. With modern AI tools, we can calculate min-max every single day. The real challenges lie beyond those.
Static logic in a non-static world
The traditional min-max approach implies that just a few figures are needed to describe the true picture of an item for an extended period of time: average demand, variability, lead time, and service level target. Whether these figures are determined annually or daily by some artificial intelligence, the logic is the same:
- Forecast a “reasonable” range of future inventory based on past experience.
- Consider this range as the primary point of reference for decision-making.
This approach only makes sense when the environment will behave more or less as it behaved before, but in practice:
- New customers and loss of customers impact the demand.
- Lead times change due to increased or decreased capacity of suppliers, new locations of their production facilities, or various disruptions.
- Items change their functions: C-category items of last year can be the core components of a new product or a new channel this year.
In any case, the min-max approach, even when frequently updated, still operates under the assumption of continuity and is always addressing the following question: “What if tomorrow will resemble yesterday?” In the volatile business environment, this very “what if” is the key question to address.
Previous sales are not the current demand
Almost all min-max algorithms and any AI that calibrates min-max optimization are based heavily on previous sales. This leads to one serious flaw:
- Sales tell us how many units we have managed to sell.
- But they don’t tell us how many units potential customers would like to buy, yet can’t because the product is sold out.
- Each out-of-stock day gets registered as zero sales, not lost demand.
If an item had high demand, but was regularly sold out last year, the historical information could show very low volume. Then, a min-max model optimized based on such historical sales information could easily conclude that the demand is poor and lower safety stock levels.
In other words:
- The information is not objective; it already reflects the results of previous inventory management mistakes.
- You will just optimize the mistakes made in the past.
AI will make it work better mathematically, but it won’t change the reality.
Averages and snapshots cover up the real picture
Min-max systems and spreadsheets usually depend on averages and current data:
- Average monthly demand, average lead time, average variance.
- Current stock vs. minimum and maximum, plus a suggested order.
The thing that they usually fail to capture is the nature of the product:
- Does it oscillate wildly between overstocks and stockouts?
- Did it suddenly increase or decrease demand significantly?
- Is this product spending most of its life in a “too comfortable” position?
Averages make the oscillations even out, and snapshots mask the pattern. It’s possible to look at an item that is “within band” right now and think that everything is okay, whereas it has been oscillating between extremes for the last six months.
Without a time-based perspective, it’s difficult to tell:
- Which min-max configurations are truly safeguarding the flow.
- Which ones are merely tying capital in unturned stock.
- When the logic itself needs changing, not just the current order.
Everything is treated equally in the table
In a traditional min-max spreadsheet, everything is merely a row:
- Item number, description, min, max, stock, recommended order.
Grid doesn’t give any information about:
- Items which generate a major part of revenue or throughput.
- Items without which production will stop working.
- Items which have narrow use and can be safely excluded from the strategy.
Without additional flags and maintenance, min-max logic will treat all the items equally and as a result:
- Low criticality items will have excess stock “because we don’t want any problems with them”.
- High criticality items will have insufficient min-max values, which were set too cautiously or haven’t been updated.
- Planners spend time chasing parameters on many items while they should concentrate only on those which really protect flow.
The spreadsheet is very good at showing levels; it is very weak at encoding item criticality in a way that drives daily decisions.
Why min-max tends to keep inventory higher than TOC dynamic buffers?
There is another important weakness of the min-max method: by design, it tends to hold more inventory than a TOC dynamic buffer‑based approach.
In a classic min-max setup:
- An item is ordered when stock hits the minimum, not on a fixed, regular supply schedule.
- Every time it is ordered, it is typically replenished all the way up to the maximum.
In practice, that means:
- You are not ordering “what is needed to safely cover the supply cycle” (order frequency plus lead time).
- You are ordering “up to max,” which often overshoots what the cycle actually requires.
- Orders therefore tend to be less frequent but larger.
The consequences are:
- More space is occupied in the warehouse, because bigger lots sit on the shelf for longer.
- More working capital is frozen at each replenishment moment, because cash is tied up in big batches instead of smaller, right‑sized orders.
AI can help recompute min-max, but it doesn’t solve these structural challenges
It looks like a tempting idea to integrate AI into min-max: the algorithm is able to go through historical data, account for seasonality, handle volatility, and compute min-max regularly. It really solves some problems:
- Parameters are not locked in for a year.
- Recent trends are accounted for faster.
- There’s less need to “tweak the numbers” in Excel.
Nevertheless, there are a few more challenges:
- AI works on the basis of historical data. It can forecast, but cannot ensure that tomorrow is going to be like yesterday.
- If the data used has been distorted due to stockouts, promotional activities, or something else, then AI can produce very accurate calculations based on very distorted data.
- Output is still minimums and maximums of each SKU. If the user interface doesn’t change, the planner still has to deal with the tables of numbers, rather than risk assessment and priorities.
Thus, the challenge becomes not “min-max is static”; but rather “min-max is backward-looking and parameter-centric”.
Some real-life problems that min-max and spreadsheets cannot reveal
From an external perspective, a min-max system backed by spreadsheets or AI appears very advanced. However, some persistent problems cannot be seen in such a system:
- Out of stock of important SKUs and high levels of total inventory at the same time
- Despite the fact that some SKUs are constantly out of stock, the financial statements reflect high amounts of capital invested in the inventory. Many items are within limits in the spreadsheet, and one does not see how wrong the approach is.
- Silent overstock of slow-moving items
- Slow-moving items never become under the minimum level, so there is no need for alarming. Slowly, they accumulate excessive stock until someone sees the items becoming expired, obsolete, or just unnecessary.
- Gradual lead‑time drift
- Suppliers increase lead times, and the process is not reflected somewhere in the parameters. Safety levels are calculated according to outdated information. Everything seems to be OK in the min-max report until the big stockout happens.
- Modification of parameters without any underlying logic
- The numbers are modified based on reactive behavior: “increase the minimum as there was an issue last month” or “decrease the maximum as Finance has requested less stock.” With time, the numbers are modified, but there is no underlying logic to support them across the whole business. The numbers are shown in the spreadsheet, but not the logic behind them.
None of these issues fit the neat categories like “min below threshold” or “max above threshold.” They are behavioral issues.
Risk in essence: depending solely on historical data for flow control in the future
Your question “what about that past sales and information can not match with future?” gets to the very core. No matter which logic you apply in inventory management based on historical data – from basic spreadsheet to sophisticated AI:
- Tomorrow is predicted to be like today.
- The risk will always lie in “what if?”: what if the demand changes, what if a new customer enters, what if the supplier falls apart, what if the product gains/loses its importance significantly?
Historical data is needed; however, it is far from enough. It shows what happened in the system as a result of previous decisions and conditions. It does not tell on its own in which places you would like to keep your security and risks.
That is the gap that min-max cannot fill on its own, even if it is recalculated every single day. It will perfect the math, but it cannot substitute for the necessity of a clear, forward-looking logic with regard to:
- Which elements require more protection.
- The amount of risk one is ready to take and where.
- Prioritization in action every day.
Read more articles
- Inventory and working capital: is inventory an investment for a business?
 Read more articles
- TOC or forecasting: TOC dynamic buffer management should drive day-to-day inventory decisions
 Companies that already use demand forecasting often ask whether it can be used alongside inventory management based on TOC dynamic buffer management. It can. The key is to define clearly what each method is responsible for.
- How to move from “Excel + gut feeling” to TOC inventory management
 For many wholesalers, distributors, and manufacturers, inventory planning sits somewhere between Excel files, ERP exports, supplier emails, and the experience of a few key people. This makes a difference. The person buying or planning for a line of products that has been in the market for years will have an understanding of the suppliers, customers, seasonality, and common issues that goes beyond anything in a spreadsheet.
